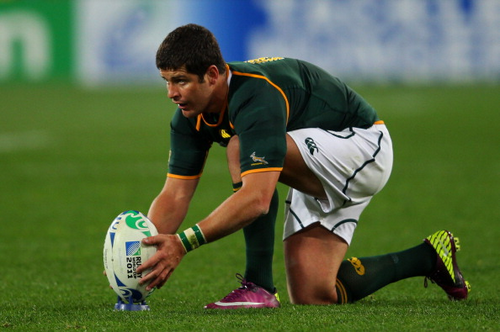
Ken Quarrie and his Kicking Model
The second in a series on place kicking analysis in rugby union. The first featured the work of Jurie Nel.
It was February and still early in the morning in Ireland, where I am based. Having nursed two cups of tea through the Skype chat to New Zealand, I was scanning my notes and hearing them in Ken Quarrie‘s measured, deliberate voice.
“All models are wrong.”
It’s an odd thing to pop out when you read back your notes after a long conversation with NZ Rugby’s Senior Scientist. In his mid forties, he is part of a small but efficient team within NZ rugby that analyses many aspects of the game. And not just at test level. He says he enjoys his job.
And, yes, all models are wrong. But necessarily so. We’ll get to that.
A Ten Year Kicking Study
We’d been talking about place kicking in rugby as Quarrie’s research paper on the subject “Evaluation of goal kicking performance in international rugby union matches”i had been published a short time before. The study analysed ten years of place kicking data from test matches worldwide and, having been publicised by NZ Rugby, there had been some media interest in the results in both the northern and southern hemispheresii. It included rankings, y’see. Easy fodder for journos.
The Quarrie/Hopkins Model’s Top Test Kickers, 2002-2011
2002: Andrew Mehrtens
2003: Jonny Wilkinson
2004: Percy Montgomery
2005: Dan Carter
2006: Dan Carter
2007: Chris Paterson
2008: Stephen Jones
2009: Chris Paterson
2010: Morne Steyn
2011: Morne Steyn
Why 2002-2011? Why not earlier, later, or longer? The answer is that after the 2011 World Cup NZ rugby was changing their data provideriii. ‘It was a nice, neat place to draw a line under that data and say “Ok, this is what we’ve got”. And it seemed sensible to do it for a decade rather than 11 or 12 years’, said Quarrie.
Distance is Everything. Well, Almost Everything.
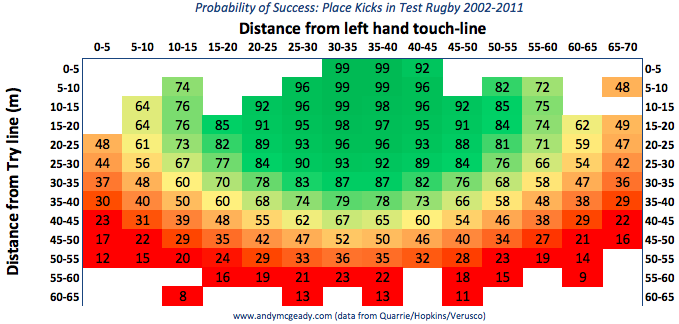
When looking at the results of the research performed by Quarrie and Hopkins it’s easy to see the significance of distance as a factor in kick difficulty at test level. Once the kick distance goes beyond 35m or so the likelihood of success drops really, really quickly.
So when a player like Francois Steyn can expand that range by a significant amount it’s worth noting. His kicking percentage was a poor 59% but when the rankings were adjusted for distance Steyn jumped up the rankings considerably, given the range from which he was called upon to kick compared to everybody else.
How does that ranking “bump” happen? Through the dataset as a whole, players kicked at a 72% success rate (increasing to 73% for those with nine or more attemptsiv). “Where we see Morne Steyn kicking 87%, he’s kicking 87% where the average player gets 73%” said Quarrie.
So far, so good. Morne’s more accurate.
But what about his namesake Frans? He of the siege gun boot?
“His average attempt was 49m while the overall average was around 32m. So what’s happening is his predicted scores are essentially being wound up because the kicks are going to be easier as you move in closer”, Quarrie told me. “We can estimate what he would be doing at the easier ranges based on his success further out given what everyone across the entire sample tends to do”.
Apart from the kicker rankings Quarrie and Hopkins also produced stadium difficulty rankings. But is the difference between two grounds really noticable?
“The differences between stadiums is small”, Quarrie told me. “There was only a 10% range over the whole lot. I think between the best and the worst, yes, you do notice a difference. You probably notice a 10% difference but you probably wouldn’t notice a 1 or 2 % difference, maybe even a 3 or 4 % difference. You’ve got to watch a lot of rugby before you would notice anything there”.
A Right-Footed Test Kicker Has No “Wrong” Side
One result that surprised me was that there was effectively no difference for a right footed kicker taking a kick from either the left or right side of the field. Individual kickers, yes. But taken as a group right-footed kickers kicked 72% from either side. It was different for left footers, with 76% accuracy from the right hand side of the field and 73% from the left.
“You would expect a left footer to be more successful on the right side of the field because typically, if they’re not hitting the ball perfectly sweetly, it tends to move a little bit left to right – i.e. they curve it a little bit to their own right side.” said Quarrie. “But we didn’t see that with the right footed kickers.”
These are not huge differences, but he said the results for right footed kickers had surprised him.
The Context of Importance
Why is kicking important? Of the total points scored in the 582 international matches included in the study, goal kicks accounted for 45%.
How Points were scored in International Rugby 2002-2011
53% Tries
45% Place Kicks
2% Drop Goals
It might seem obvious, but three points scored in a tight game with a couple of minutes left is different than those same three points scored while 40 points up (or down) with 20 minutes to go. A kick “importance” factor was calculated using the scores at the time of the kick as well as the amount of time remaining in the match.
Clutch Kickers
1 James O’Connor
2 Morne Steyn
3 Stirling Mortlock
4 Gonzalo Quesada
5 Olly Barkley
That element of context provides an extra bit of depth to an analysis, especially when one considers the associated individual pressures that come with the job of place kicker. It’s clear from talking to Quarrie that a key driver for this research was to look beyond the immediately obvious factors of angle and distance.
Quarrie’s dataset contained 6,769 kick attempts from 2002-2011, a time period that happened to coincide with a large chunk of Dan Carter‘s test career. Carter had 563 attempts in the study, compared to just 11 for Leigh Halfpenny.
Most Kicks in the Study
563 Dan Carter
405 Stephen Jones
352 Ronan O’Gara
291 Jonny Wilkinson
265 Chris Paterson
Very handy for publicising by New Zealand Rugby but, Quarrie assured me, entirely coincidental. “It would have been interesting to get the likes of Neil Jenkins and Andrew Mehrtensv through the better part of his career in there as well” said Quarrie. “And likewise Halfpenny in the last year or so”.
What if we could go back to the metronomic Jenkins? And Eric Elwood? To John Eales and Hugo Porta?vi
Games change over time, with the relative importance of what is measured changing accordingly. In the NFL, nobody would reasonably compare the passing stats of a quarterback from the 1970s with those of today’s pass-happy league where quarterbacks are cosseted like goalkeepers. Context is everything. But where rugby place kicking is concerned it would certainly be of interest to many to see the stats from past players compared to present. The ability to make that kind of historical comparison can provide data-rich sports like baseball and cricket with an element of barstool debate that is hard to replicate in other games.
But stats are not everything.
Ranking Goal-Kicking, Not Players
There is a danger, when looking at players through stats, that one ignores the rest of their game. “There are a range of factors that are considered when selecting players”, said Quarrie, “of which, if you are a goal kicker, goal kicking is one. But there are a whole lot of other factors that come into play when people are making decisions about who to pick and who’s going to take what roles in games.”
Irish Test Kickers 2002-2011 (raw success rate / adjusted)
David Humphreys (81%/76%) – 113 attempts
Ronan O’Gara (71%/74%) – 352 attempts
Paddy Wallace (77%/73%) – 22 attempts
Jonathan Sexton (60%/68%) – 62 attempts
Take Jonathan Sexton, for example. The Irish and Lion fly half is not the most consistent marksman that has strode this planet, although he has improved since those early international daysvii. But when one looks at his combination of attacking and defensive skills he is one of the most rounded players in rugby. When the rest of his game is so potent you can get by with his being an average Test kicker.
From Box to Borges: Useful vs Perfect
Differences between competitions were not included as a factor in the study (e.g. the pressure of a kick in a World Cup final versus a kick in a June test), nor differences within competitions, nor bonus points. They are areas to perhaps be included in future research.
In saying “All models are wrong”, Quarrie was paraphrasing the English statistician George Box (1919-2013) who wrote “essentially, all models are wrong, but some are useful”.
“Things don’t have to be perfect to be useful, they just need to be better than nothing. It’s a very pragmatic way of looking at things. We could spend a whole of time and effort and energy trying to make something perfect but no model is perfect, all models are wrong.
“What [Box] was getting at was that we can’t capture all of the salient elements of a process or a system. The whole point of modelling it is to push away some of those things that we think are of less import and capture the things that we think are mainly important. If we can do that then hopefully they can guide us to make reasonable decisions.”
A map, for example. “There was a lovely little paper by Jorge Louis Borgesviii“, said Quarrie, “which was on the exactitude in science. It was about this fictional country where they got into map-making and they wanted to be so good at it that they started building bigger and bigger and more exact maps until finally they had a 1:1 scale map.”
Mapmaking perfection. An exact replica. Perfect in every way. But useless. A map is a model, a representation of geography. Every map is necessarily incomplete. Imperfect. And it must be so in order to be useful.
Perhaps appropriately, in our chat we happened upon a small flawix in the model – nothing that would invalidate the findings as a whole, just one more thing to add to the inexactitude in science.
Next: Bringing this all together… Decision Making.


Excellent post. I used to be checking continuously this blog and I am impressed!
Very useful info particularly the remaining
part :) I care for such information much. I was seeking this certain information for a
long time. Thanks and good luck.
I do agree witfh all of the concepts you have prfesented in your post.
They are really convincing and will certainly work.
Nonetheless, the posts are too sbort forr starters. Could you please lengthen them a bit fdom next time?
Thank you for the post.
Very nice blog post. I absolutely love this site.
Stick with it!
This post is worth everyone’s attention. How can I find out more?
Crabs are a good source of the omega-3 fatty acids that help lower blood pressure, reduce the rick
of heart diseases, lower triglycerides, enhance your immune system and lower the
risk of getting cancer. Collect the details of the products you intend to buy.
I have observed patterns among those who have successfully reversed health problems.
An impressive share! I have just forwarded this onto a friend
who was conducting a little research on this.
And he actually bought me lunch simply because I discovered it for him…
lol. So let me reword this…. Thank YOU for the meal!!
But yeah, thanx for spending time to talk about this matter here on your web page.